Passenger Traffic in Croatian Ports
Passenger Volume
Here are some figures about passenger volume in Croatian ports and passengers carried on ferry routes operating in Croatia.
Number of passengers in Croatian ports (in 000’s)
Transport by Ferries, Passenger Boats & Ships (2000-2022)
Source: DZS (Croatian Bureau of Statistics)
How many passengers use Croatian ports per year?
27 MM passengers used Croatian ports in 2021 representing an increase of 144.19% compared to 2020 (18.78 MM). The best year so far was 2019, when 34.14 MM passed through the ports. In 2022, the total numbers are 33.8 MM. The lowest number of passengers (in the last 10 years) was recorded in 2020 when 18.78 MM passed through the ports. The complete figures for 2022 are released in February 2023.
The figures include the transport of passengers including ferries and passenger ships on domestic routes and international passenger transport and traffic between Croatia and foreign ports (Italy).
The statistics are together with the other transport statistics used for analyses of the transport of passengers.
What are the busiest passenger ports in Croatia?
The busiest passenger ports in Croatia are Split and Zadar. Here is a table of passenger numbers of the top 5 busiest passenger ports in Croatia:
| 2021 | 2019 | Index 2021/2019 | |
| Split | 3745 | 4958 | 0.76 |
| Zadar | 2081 | 2319 | 0.90 |
| Preko | 1782 | 1921 | 0.93 |
| Korcula | 1679 | 2121 | 0.79 |
| Supetar | 1597 | 1966 | 0.81 |
As you can see from the above table, Split port, which is the busiest one in Croatia, lost in 2021 a quarter of its 2019 traffic. In comparison, Preko port, just across the Zadar, lost just 7% of the traffic. The reason for that is that a large chunk of traffic in Split port is accounted for tourist passengers while Preko mainly serves local (domestic) passengers.
Passenger volume data info
This data represents annual data of passengers embarked and disembarked in all ports – a piece of information on maritime sea transport (seaborne transport) of passenger movements calling at Croatian ports. Data include the number of embarked and disembarked passengers in all public seaports in the Republic of Croatia that is open for public passenger traffic. This maritime transport data refer to passenger movements (in the number of passengers). In the current form, the statistics have been made since 2000.
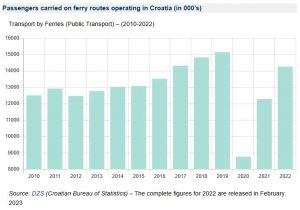
Passengers carried on ferry routes operating in Croatia (in 000’s)
Transport by Ferries (Public Transport) – (2010-2022)
Source: DZS (Croatian Bureau of Statistics) – The complete figures for 2022 are released in February 2023
There was a total of 14 million passengers carried on ferry routes in Croatia in 2022. The best year so far is 2019 when 15 million passengers were carried.
Here is a table view of transport by ferries 2010 to 2022:
| Year | Passengers (in 000’s) | Index |
| 2010 | 12506 | – |
| 2011 | 12926 | 1.03 |
| 2012 | 12474 | 0.97 |
| 2013 | 12770 | 1.02 |
| 2014 | 13029 | 1.02 |
| 2015 | 13082 | 1.00 |
| 2016 | 13525 | 1.03 |
| 2017 | 14315 | 1.06 |
| 2018 | 14821 | 1.04 |
| 2019 | 15142 | 1.02 |
| 2020 | 8774 | 0.58 |
| 2021 | 12280 | 1.40 |
| 2022 | 14261 | 1.16 |
These figures include all public ferry routes within Croatia as well as international routes between Croatia and Italy. See also Passenger Transport Volume on Ferries in Croatia and vehicle transport traffic on car ferries in Croatia.
Ferry Schedules and Info
- Croatian Islands Ferries
- Ferry Timetables
- Ports
- Ferries from Italy to Croatia
- Ferries to / from Croatian Islands
- Ferries to / from Croatian Mainland
- Booking Ferries in Croatia
- Prices
- Ferry Companies
- News
- FAQ
- Tips and Guides
- Ferries Map
- Island Hopping
- Forum
- Ferry service status and weather forecast
- Ferry Photos
- Accommodation
- Car Hire
Connect with us


